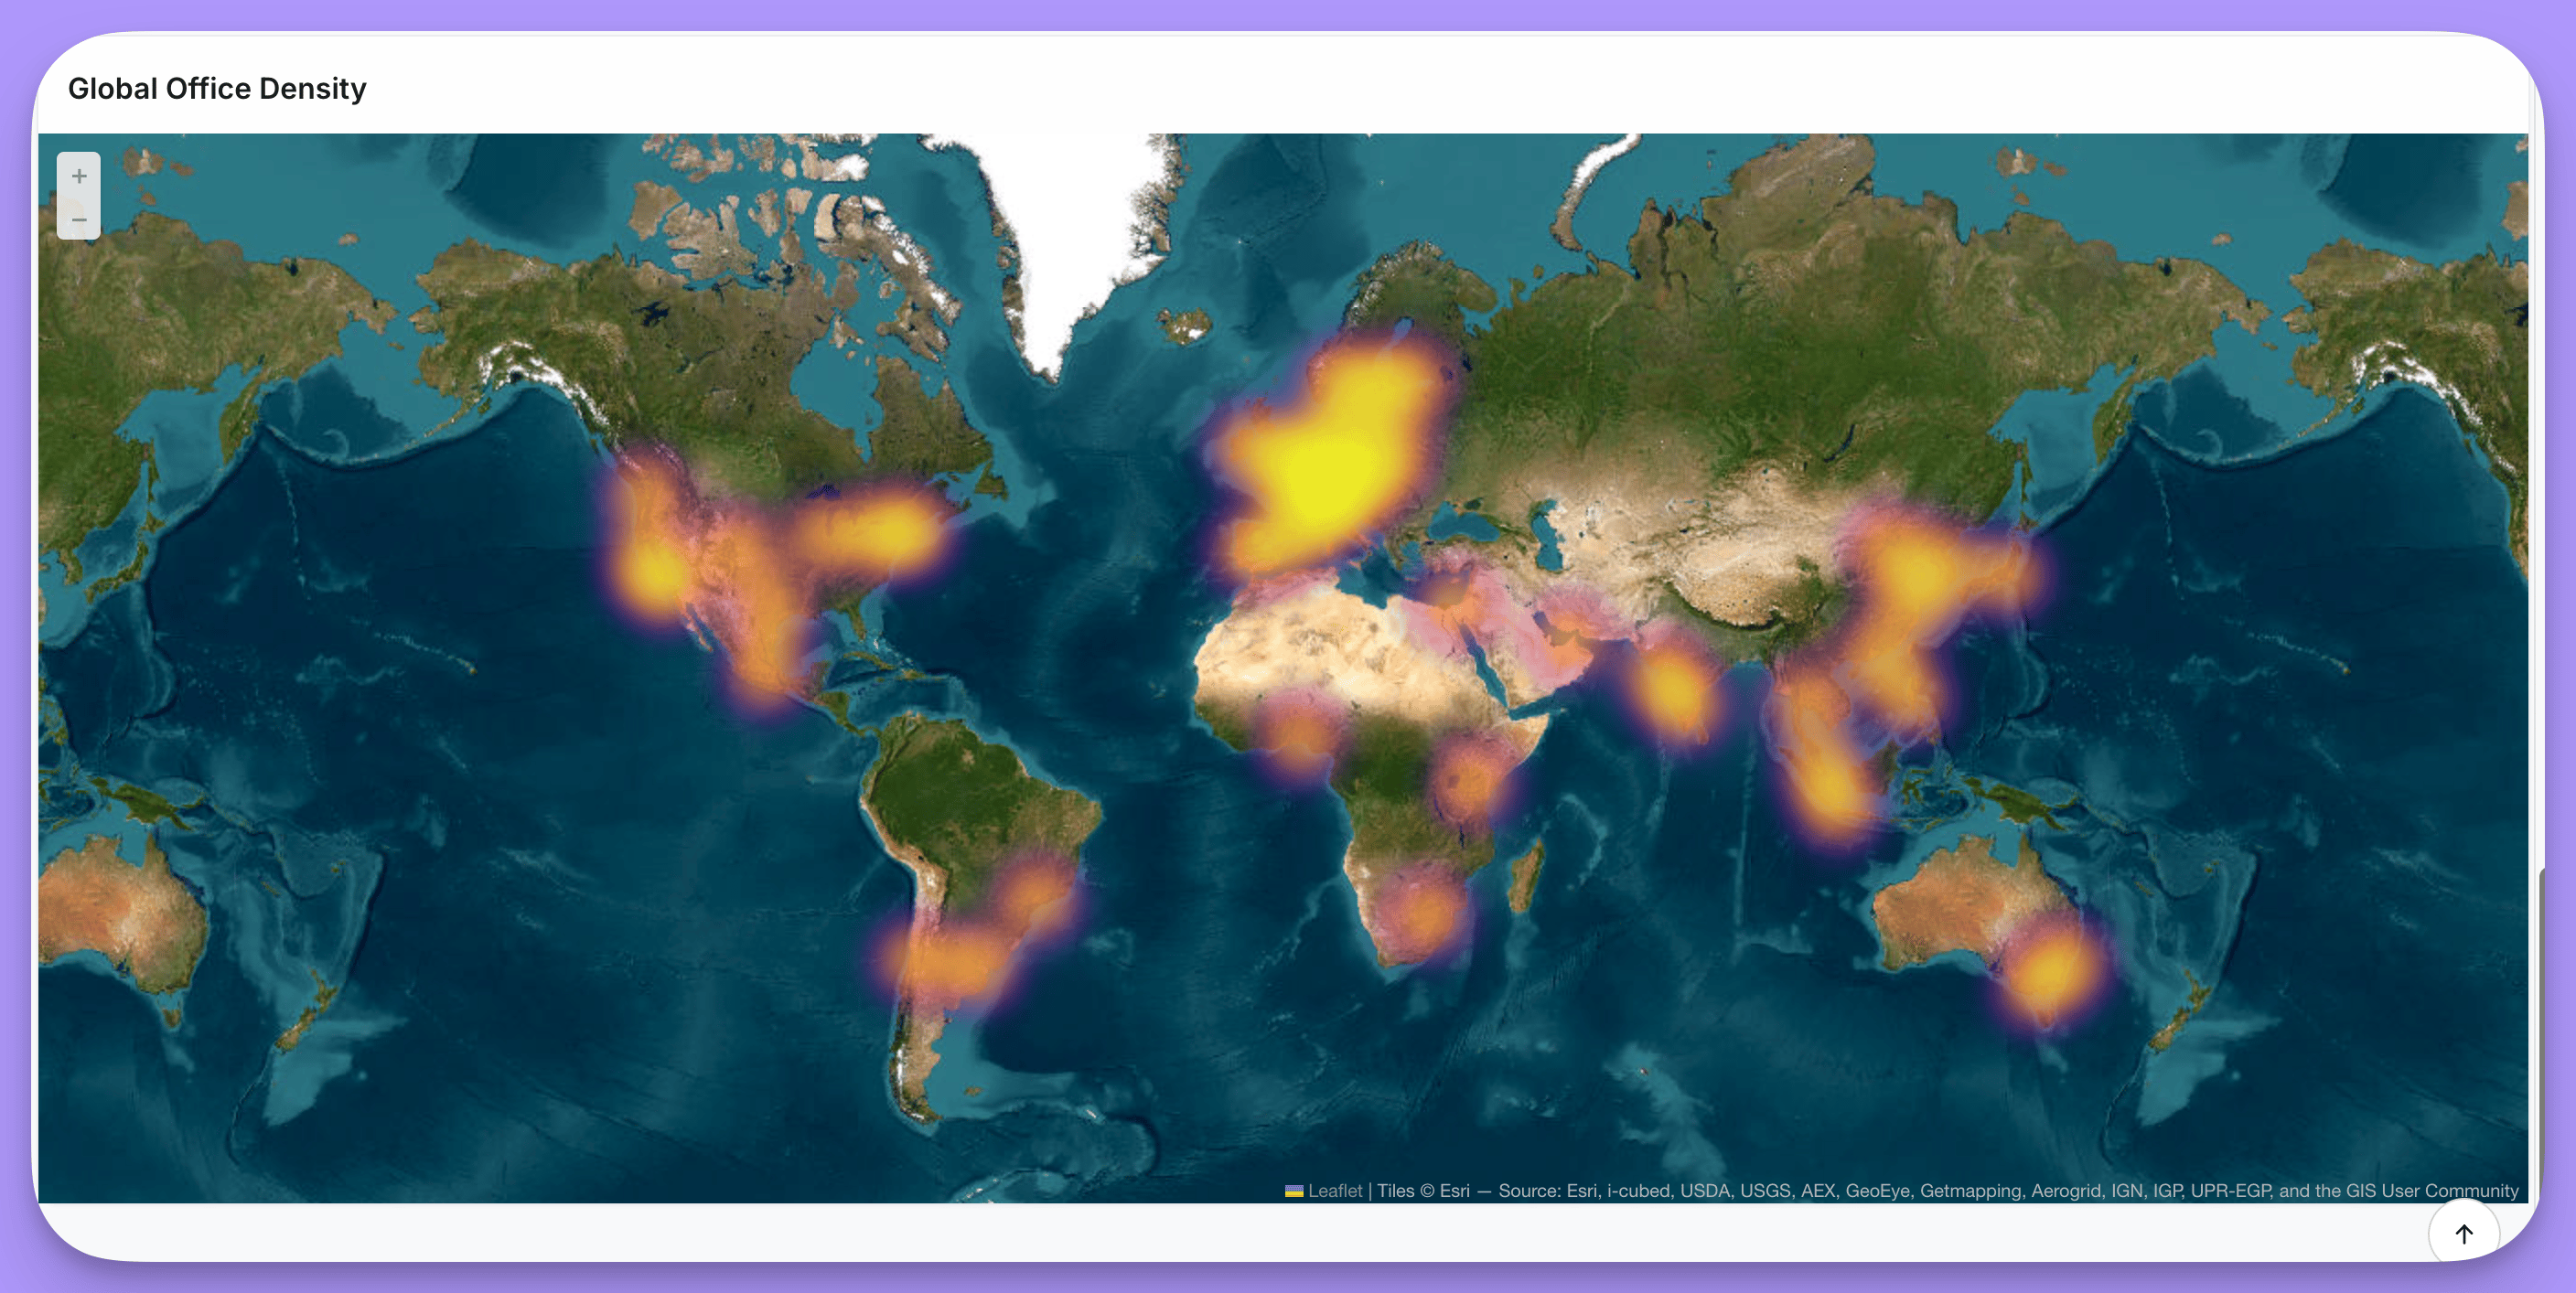
See maps in action
Explore an interactive demo dashboard with scatter maps, area maps, and heatmaps.
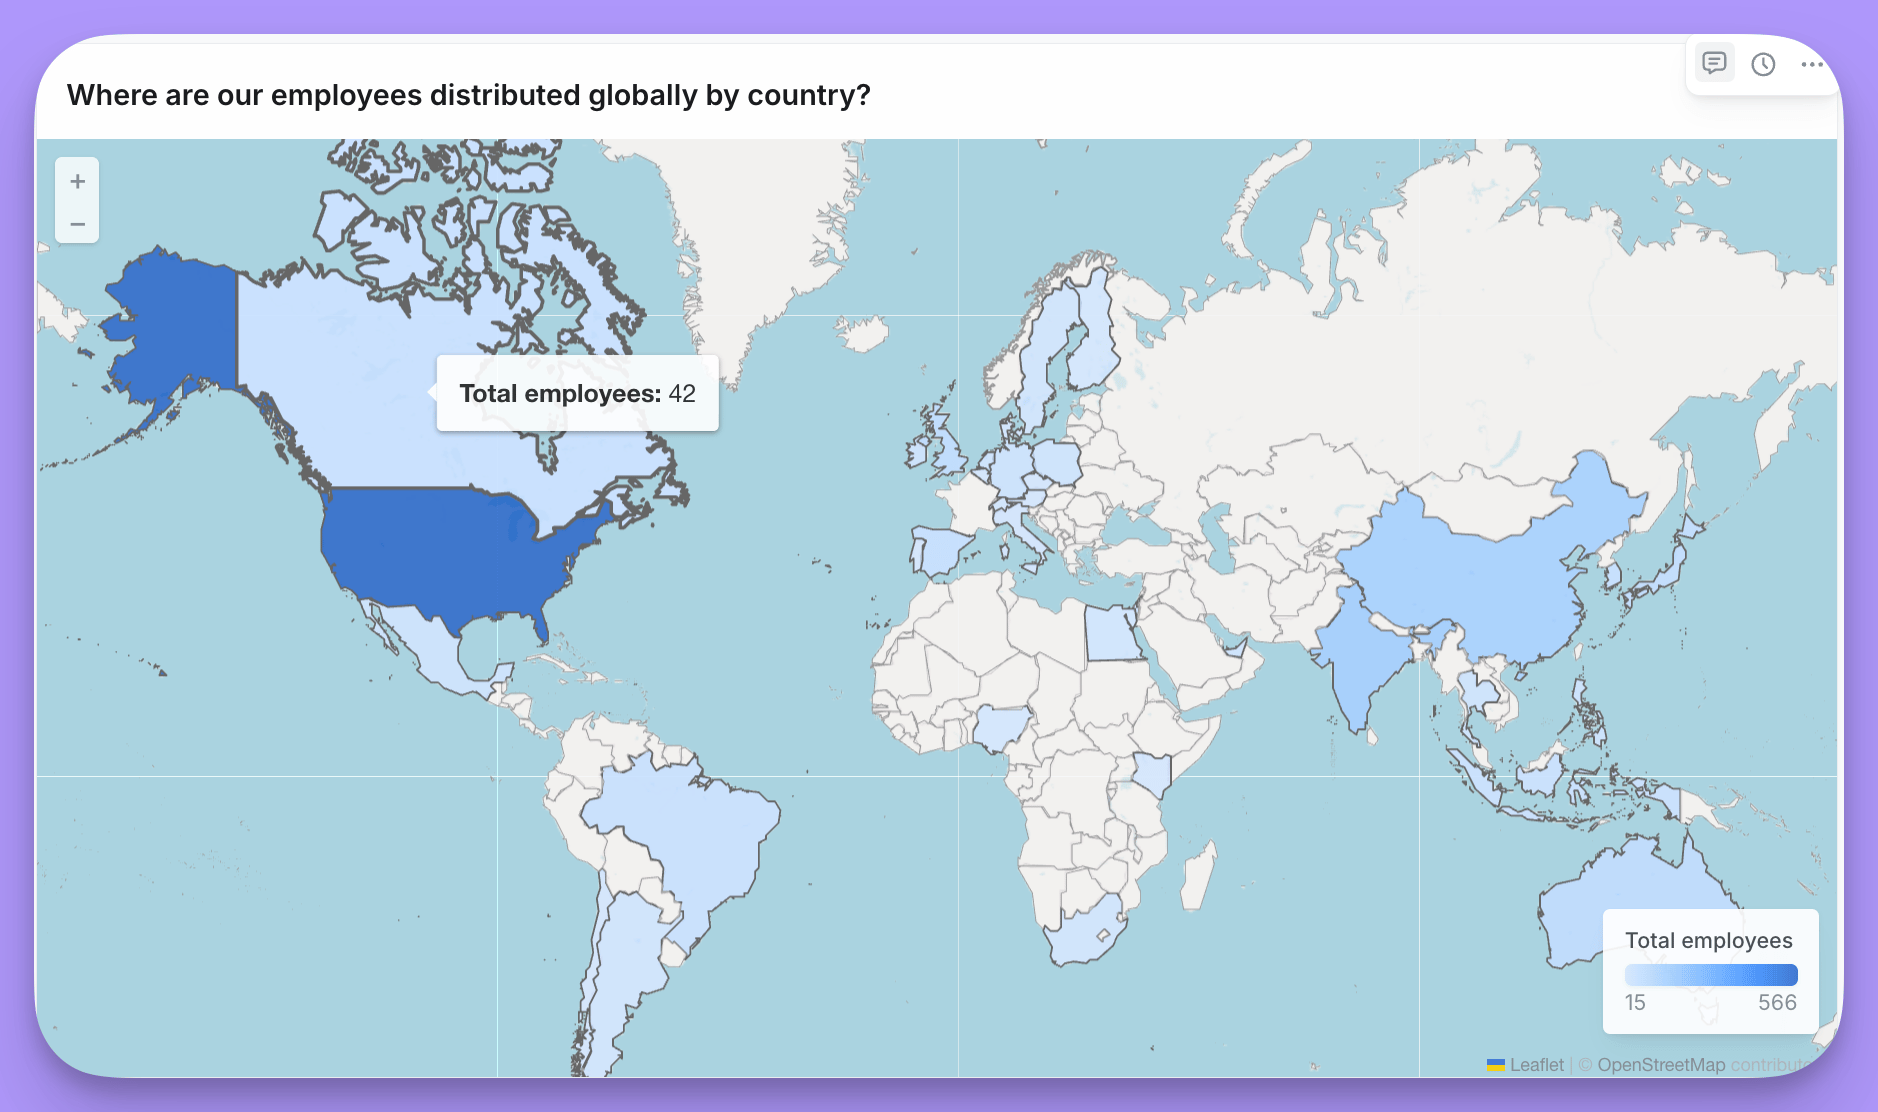
- Scatter - Plot individual points using latitude/longitude coordinates
- Area (Choropleth) - Color regions based on values
- Heatmap - Show density of points as a heat overlay
- Visualizing geographic distribution of data
- Showing regional performance or metrics
- Displaying location-based patterns
Scatter maps
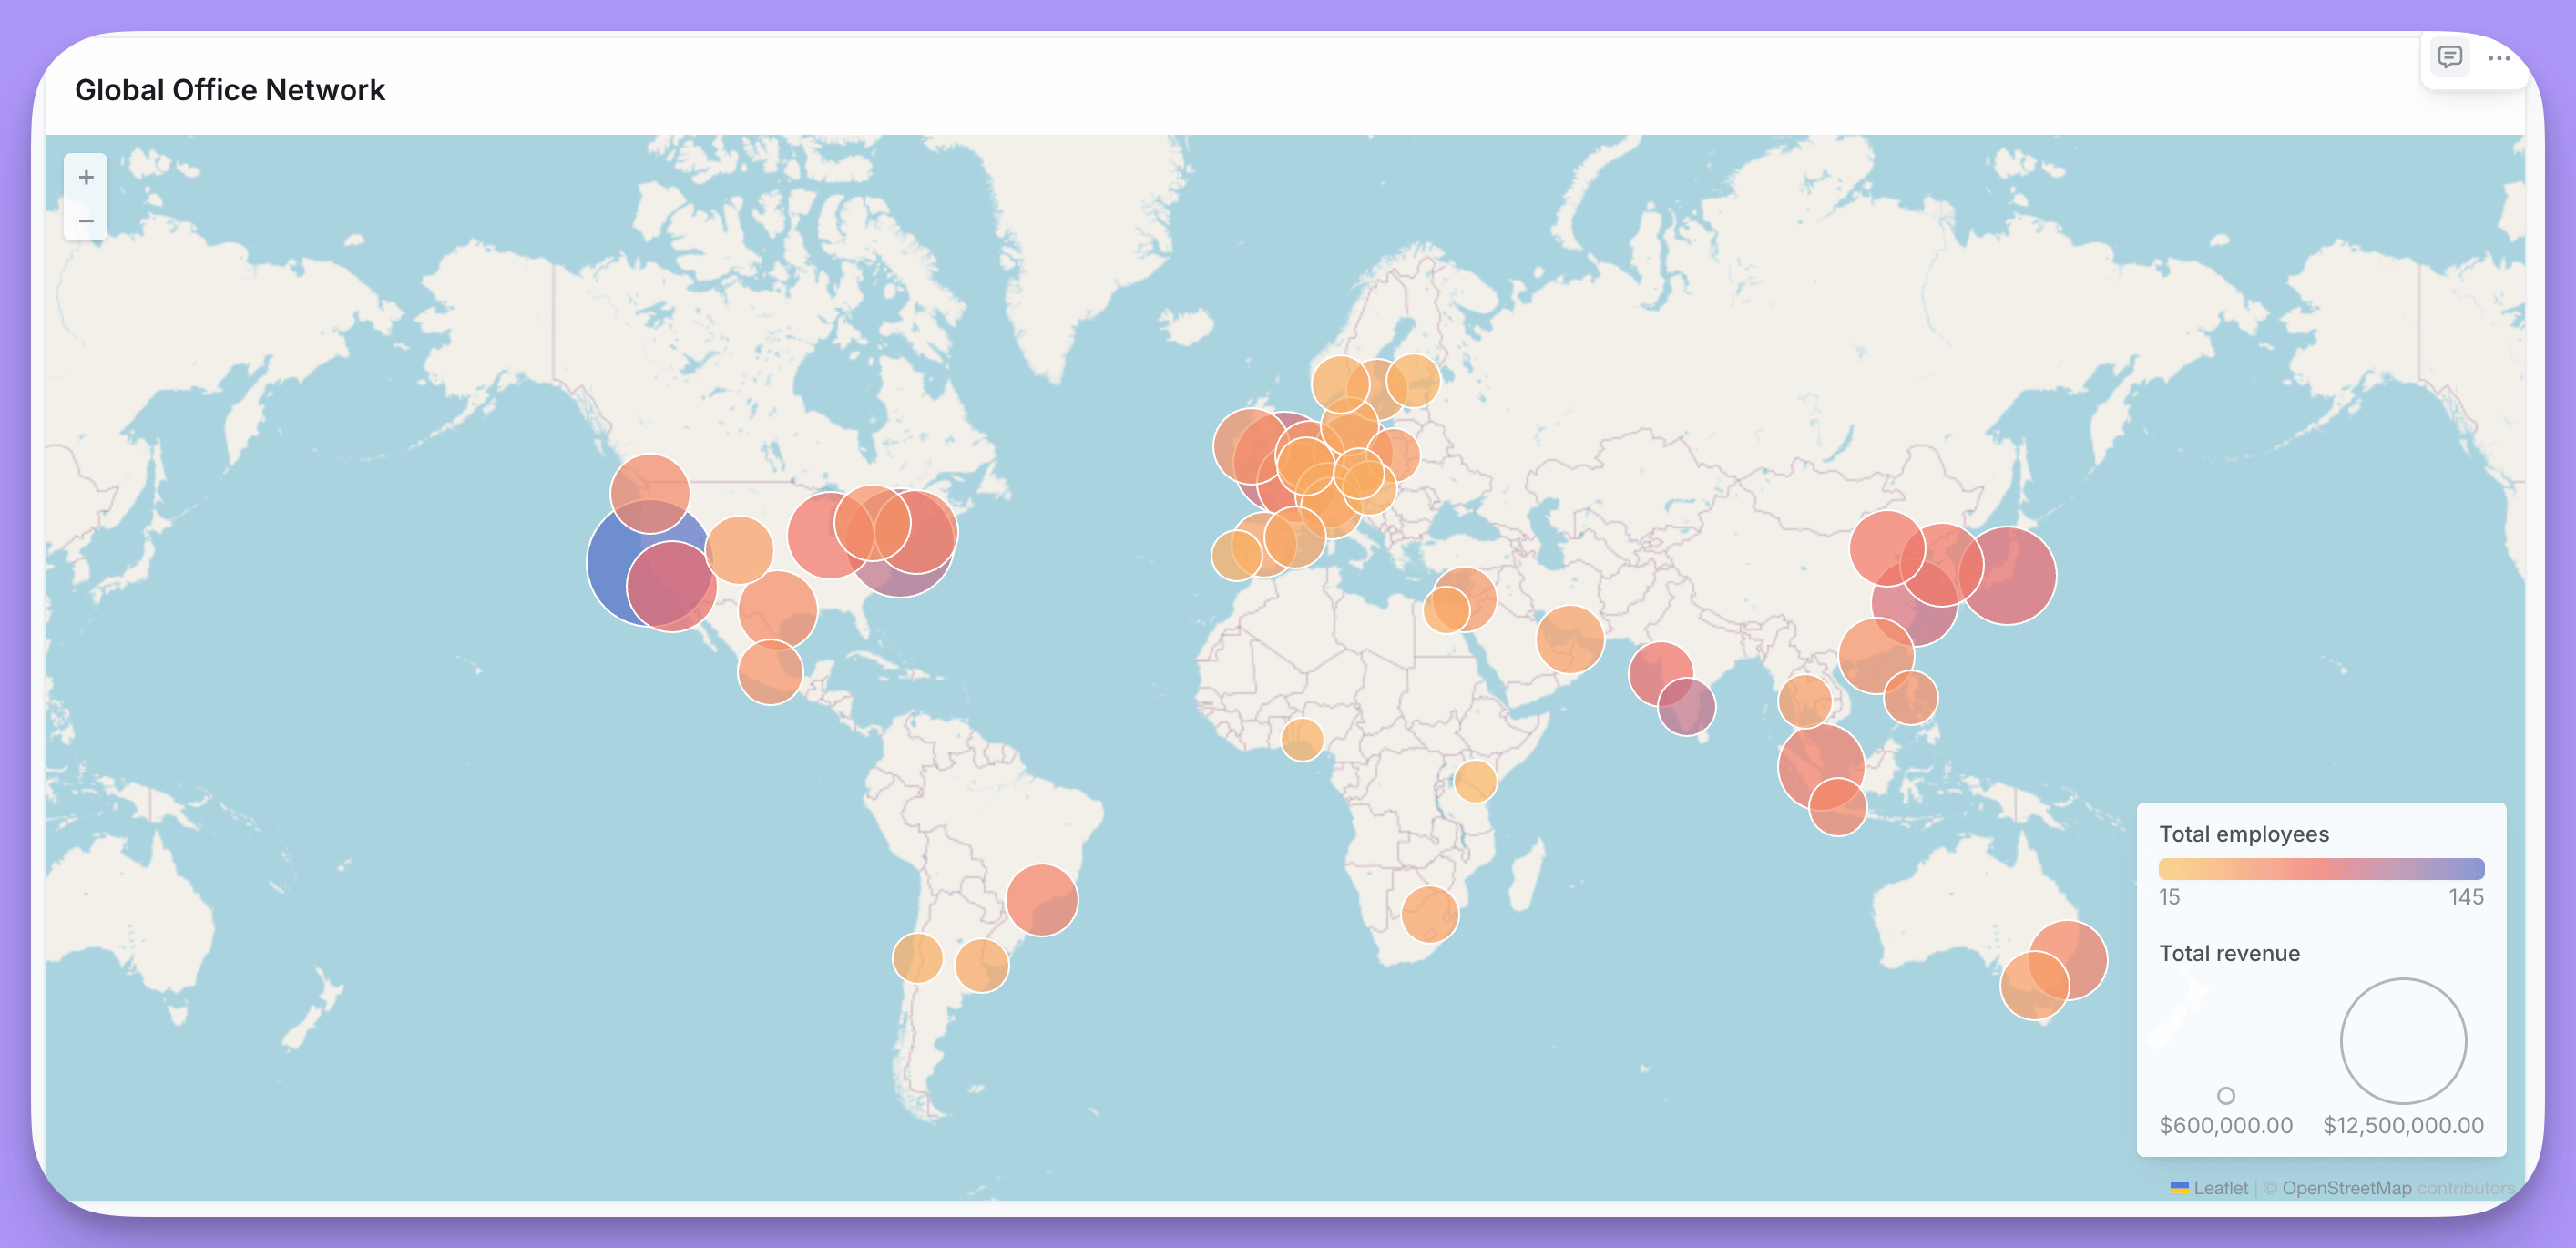
Data requirements
Your data must include latitude and longitude coordinates. If your data contains addresses instead of coordinates, you’ll need to geocode them to latitude/longitude values using a third-party geocoding service before using them in a map.Layout options
Display options
Area maps (Choropleth)
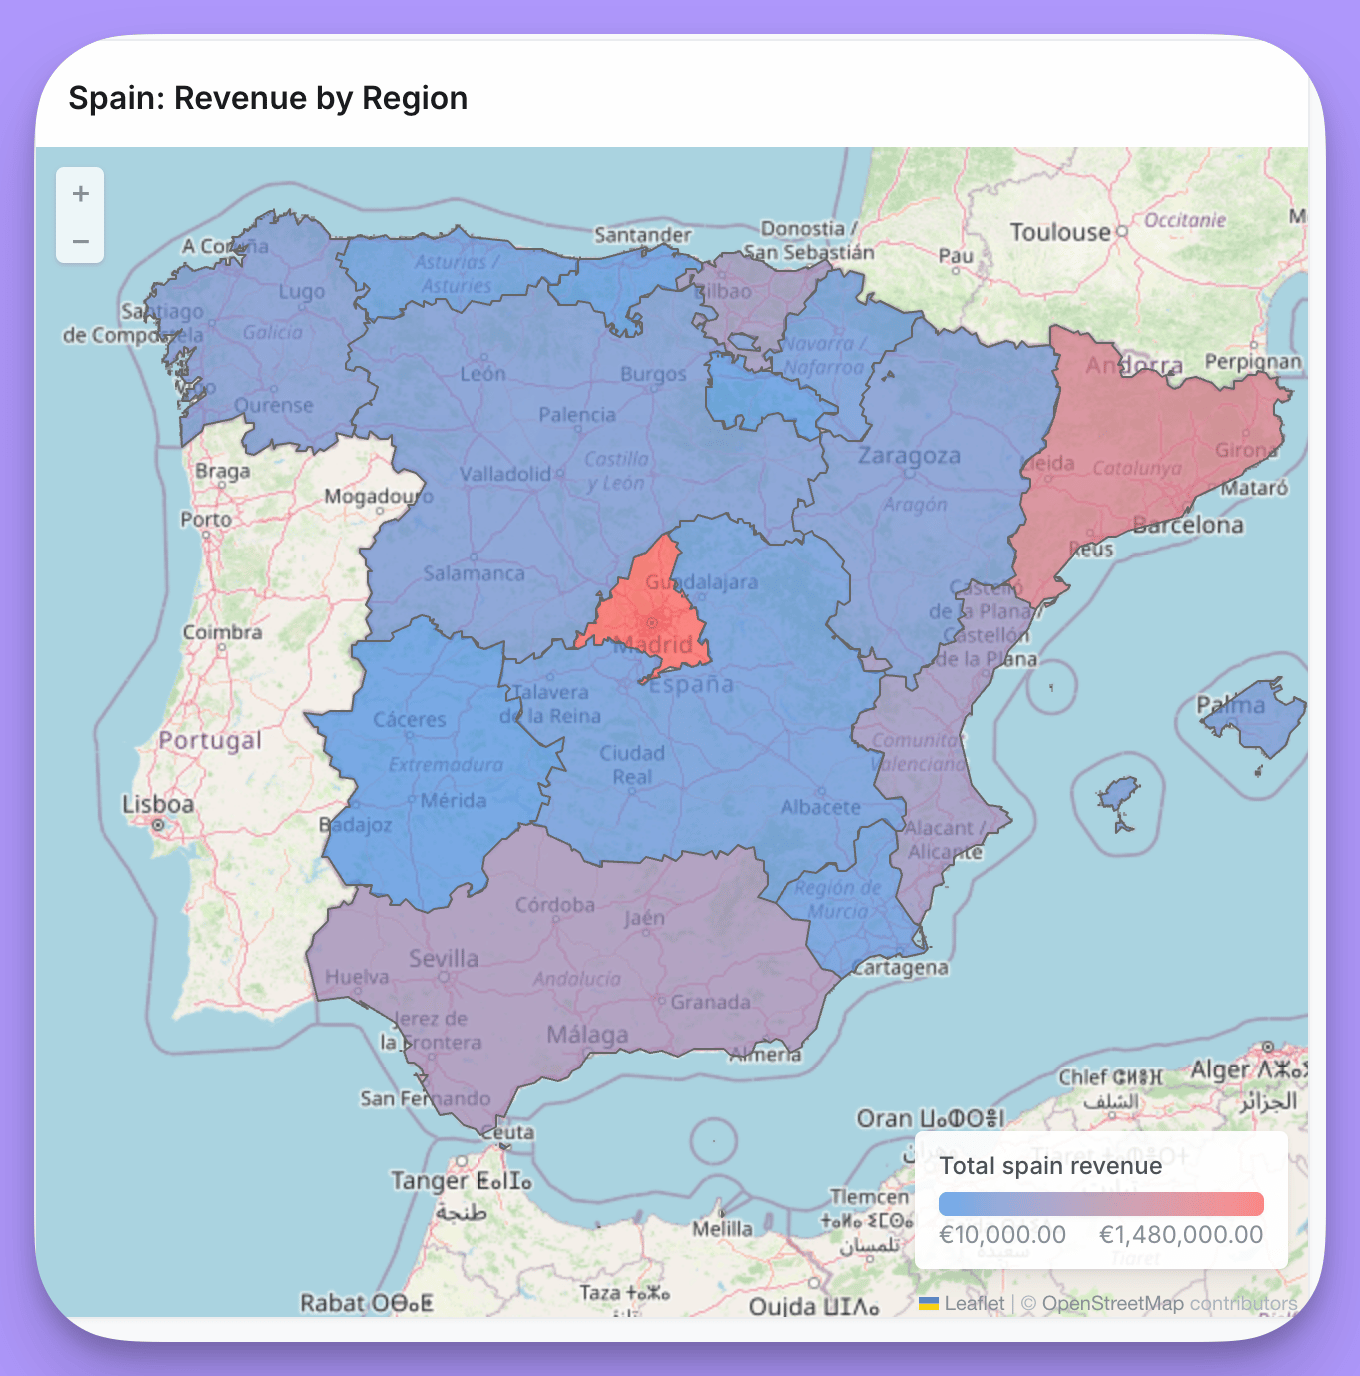
Data requirements
- Country codes - ISO 3166-1 alpha-3 codes (e.g., “USA”, “GBR”) for world maps
- US state codes - State abbreviations (e.g., “CA”, “NY”) for US maps
- Custom identifiers - Any identifier that matches a property in your custom GeoJSON file
Layout options
Using custom GeoJSON
When you enable Custom region, you can provide a URL to any GeoJSON file that defines your region boundaries. After entering the URL, Lightdash loads the available properties from the GeoJSON and displays them in the Map join field dropdown. Select the property that contains values matching your data. For example, if your GeoJSON has apostal_code property and your data has a zip_code field:
- Enable Custom region and enter your GeoJSON URL
- Select
postal_codefrom the Map join field dropdown - Select your
zip_codefield as the Data join field
Custom GeoJSON URL requirements
Lightdash fetches custom GeoJSON files through a server-side proxy that enforces the following requirements:- The URL must use HTTPS.
- The file path must end in
.json,.geojson, or.topojson. - The file must be 10 MB or smaller and the host must respond within 30 seconds.
- The host must be a public address. URLs that resolve to private, loopback, link-local, multicast, or carrier-grade NAT IP ranges are rejected.
- Redirects are not followed. Host your file at a stable URL that responds with
200 OKdirectly.
Display options
Heatmaps